

Health
Mandaluyong is host to a number of public and private health facilities that provide for the health care needs of the city’s populace.
The City Medical Center and other Private Tertiary Hospital
Curative health services are provided by one (1) public and three (3) private hospital facilities (Table 5.07). This is excluding the specialized facility for mental health being provided by the National Center for Mental Health in Welfareville Compound.
The Mandaluyong City Medical Center (MCMC) is the only government hospital of the city that provides for tertiary level health services to local constituents. It is currently in its final phase of completing its physical expansion that will generate additional bed capacity and much improved facilities.
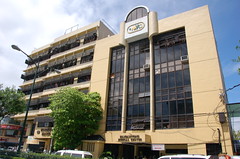
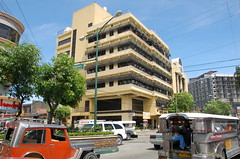
MCMC has a total manpower of 375 consisting of 116 medical professionals, 38 ancillary personnel, 120 nurses and nursing aides, and 101 civilian employees. The five-floor hospital structure has an existing bed capacity of only 105. However, the completion of the annex building will expand its bed capacity to 300 and will house the following sections:
- Surgical ward, medicine office, Office of the Head Nurse
- Medicine Wards, Reception, Social Welfare, Surgical Office
- OB ward/ OB Gyne Office
- Storage Room
- Emergency Areas, OR Support Rooms
- Central Storage and Sterilization Room
To ensure exclusivity of medical services, local residents are being encouraged to avail of the “Manda Card” currently being issued by the MCMC. However, it still remains hospital policy to serve all in dire need of medical attention especially in times of emergency. Table 5.08 outlines the MCMC Services and facilities as available per floor level.
The Local Health Centers
Resources, Facilities and Services
Twenty-six (26) health centers scattered in various barangays provide local health services to the city residents. Ten (10) of these health centers are certified by the Department of Health (DOH) as “Sentrong Sigla” centers, which means that these centers have passed stringent evaluation criteria on quality health servicing. Generally, all health centers provide preventive health services such as general medical services, dental and optical service, laboratory services, nutrition supplements and immunization programs.
These health centers, listed in Table 5.09, are under the administrative and technical supervision of the City Health Office whose responsibilities extend to continuous monitoring of water supply and ensuring public access to safe water and promoting the use of sanitary toilet facilities particularly in depressed areas.
Specifically, the city health centers focus on three major health programs/services: Family Health, Infectious Disease Control, and Prevention and Control of Non-Communicable Diseases. Summary of activities under these services is listed in the proceeding table (Table 5.10).
Two (2) Lying-in clinics provide supplementary health service to mothers. Their services include: attendance to normal deliveries, referrals of all cases with complications to hospitals, newborn screening and care, and breastfeeding.
The average number of patients served daily ranges from 20 to 70 persons per health center depending on the location and area coverage. (Table 5.11).
Each of these centers has a complete compliment of at least one (1) physician, one (1) or two (2) nurses, two (2) or more midwives, a dentist, a dental aide, a laboratory aide, a nutritionist, Barangay Nutrition Scholars and Barangay Health Workers.
Total government expenditure on health services (City Health Budget) amounts to seven percent (7 %) of the overall city budget for the year 2002.
Spatial distribution of health facilities is shown in Map ~ Health Facilities.
Causes of Mortality and Morbidity
Consolidated reports from the City Health Office and hospitals reveal a total of 7,106 live births delivered in year 2002 giving a crude birth rate of 23.99% for every 1000 population, slightly higher than a CBR of 22.74 in 2001.
Crude death rate has been increasing at 3.35, 3.5 to 4.0 for the years 2000, 2001, and 2002, respectively (see Table 5.13a; Table 5.13b; Table 5.13c; Table 5.13d) for causes of death by specific age group.
Infant mortality increased by more than 2% from 14.87% in 2001 to 17.03% in 2002 with prematurity as the top most cause of death followed by pneumonia. There is, however, no recorded incidence of death among women in pregnancy, labor and post partum in 2002 as compared to the previous years wherein Abrupto Placenta was often the cause of death.
For all ages, on the other hand, Cerebro Vas Acc. and Pneumonia have been consistently the two (2) leading causes of deaths as reported by the MCMC for the years 2000, 2001, and 2002. The CHO likewise reported Pneumonia as the leading cause of death, along with Myocardial Infarction and Cancer.
Deaths due to epidemic occurrences such as dengue, leptospirosis and typhoid fever had been controlled in 2002 although there were several cases of individual affected by such diseases. Cases of measles reduced considerably in 2002. Unfortunately, there are still cases of deaths even in the current year despite intense efforts of the city health officials to cover every local household in the government’s measles prevention program.
Evidently, lack of cooperation on the part of the residents mostly in depressed areas is the main culprit in this failure to eradicate measles in the city. This February, the City Health Office once again actively participated in the nationwide campaign against measles by deploying teams of health personnel to provide immunization shots to children below eight (8) years old, covering all households, day care centers and schools as well.
Incidence of common disease for children 0-4 years old and patients of all ages are shown in Tables 5.14a; Table 5.14b; Table 5.14c.
For other health concerns, the 2002 record shows a General Medical Consultation Rate of 34 and 278 for city health centers and the Mandaluyong City Medical Center, respectively. In addition, MCMC recorded an annual hospitalization rate of 33 with a total hospital admission of 9,650 in 2002. Compared with the health centers (Table 5.11), MCMC serves an average of over 250 patients daily, decreasing at 313, 274 and 252 in 2000, 2001, and 2002, respectively.
Degree Of Malnutrition
With the objective of monitoring the nutritional status of children under seven (7) years old and at the same time provide adequate intervention in the problem on malnutrition, the City Health Office conducts annual weighing of children in this age group through the Operation Timbang Project. A summary report of this project is presented in Table 5.15.
As expected, Brgy. Addition Hills has considerably the largest number of children suffering from 2nd and 3rd degree malnutrition. This, however, is primarily due to the fact that this barangay is the most populated and at the same time site of the largest informal settlement in the city. Moreover, intensive efforts to address this situation resulted to about 50 percent reduction in the number of cases from 2000 to 2002.
While a regional evaluation on nutrition services puts the city of Mandaluyong among those with very low performances, it is recognized that this may be due to poor documentation of the city’s accomplishments. In fact, such accomplishments were highly commended during the latest advocacy meeting between the city government and the National Nutrition Council.
As a consequence, the City Nutrition Committee is reactivated involving more local government offices to facilitate, coordinate and properly document delivery of nutrition services to the community. In addition, Barangay Nutrition Committees are formed to ensure proper adoption and implementation of the National Nutrition Program at the barangay level.
Family Planning
Focusing on gender sensitively and reproductive health, the City Health Office has continuously put intensive efforts to promote the use of various family planning methods to local couples.
Inspite of this, there are no significant changes in Contraceptive Prevalence rates for the years 2000 to 2002 (Table 5.12). However, recruitment of new acceptors and maintenance of continuing users (Table 5.16 & Table 5.17) show relatively good results in most barangays.