

POPULATION SIZE
The 2015 Census gave a new population count of 386,276, around 3% of the 12,877,253 population for NCR in the same year. Among the 17 cities and municipalities in the region, Mandaluyong ranked as the 5th smallest in population (Table 2.01).
In the absence of published information and studies concerning daytime population in the city, there is a suggestion that having acquired a full level of urbanization, Mandaluyong City follows the trend in Makati City by which daytime population is three (3) to four (4) times its night time population. However, the Mandaluyong City Police Department anticipates a daytime population of 1.2 million in programming its daily public safety activities.
|
Table 2.01. Total Population, Household Population, and Number of Households by City/Municipality: NCR, 2015 |
|||
|
City/Municipality |
Total Population |
Household Population |
Number of Households |
|---|---|---|---|
|
Total |
12,877,253 |
12,786,611 |
3,095,484 |
|
City of Manila |
1,780,148 |
1,763,009 |
435,154 |
|
City of Mandaluyong |
386,276 |
377,850 |
100,356 |
|
City of Marikina |
450,741 |
448,893 |
98,238 |
|
City of Pasig |
755,300 |
753,030 |
180,612 |
|
Quezon City |
2,936,116 |
2,919,320 |
683,044 |
|
City of San Juan |
122,180 |
120,815 |
28,623 |
|
Caloocan City |
1,583,978 |
1,581,025 |
367,878 |
|
City of Malabon |
365,525 |
364,283 |
86,191 |
|
City of Navotas |
249,463 |
249,176 |
60,904 |
|
City of Valenzuela |
620,422 |
619,324 |
153,041 |
|
City of Las Piñas |
588,894 |
587,675 |
141,925 |
|
City of Makati |
582,602 |
579,433 |
154,095 |
|
City of Muntinlupa |
504,509 |
481,762 |
122,286 |
|
City of Parañaque |
665,882 |
663,733 |
163,074 |
|
Pasay City |
416,522 |
412,497 |
107,619 |
|
Pateros |
63,840 |
63,643 |
14,188 |
|
Taguig City |
804,915 |
801,143 |
198,256 |
|
Source: National Statistics Office, 2018 February Validation of Data on Population and Households |
|||
Of the 27 barangays in the city, Addition Hills is the most populated consisting of more than one-fourth of the total population in the city, while Buayang Bato has the least population of 1,782 or about 0.46% of the total population.
During the last two decades, barangay populations in the city were never stationary. While rapid population growth is often associated with fertility and the decline in mortality due to milestone achievements in science and technology, migration, especially from nearby provinces like Bulacan, Rizal, and Cavite, to cities in Metro Manila like in Mandaluyong, has always played an important role in shaping up the trends in population.
AGE AND SEX COMPOSITION: CENSUS 2015
Age-Sex Structure
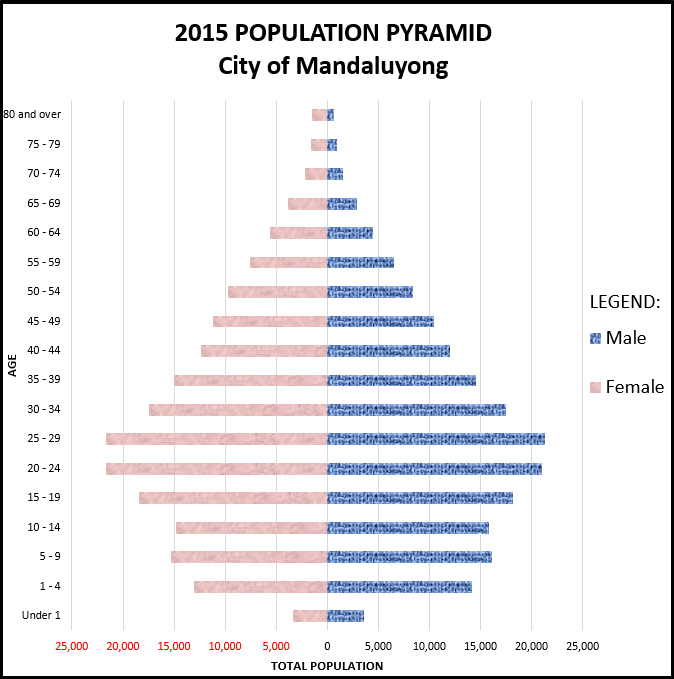
For the year 2015, the males comprise 49.12 percent of the population and the females 50.88 percent. This gives a male-female ratio of 96.6 males per 100 females, which means that the female population outnumbers the males by about three persons.
Still, in the elderly group (ages 60 and over), the males are outnumbered by females with a ratio of 64 males for every 100 females. For the 0-14 year olds, the male children outnumber the female children at a ratio of 1: 0.94.
The 2015 population pyramid as shown in Figure 2.01 is of expansive character. This means that a large percentage of the population is young, belonging to the 5-29 years old bracket. The pyramid also reflects specific age groups representing demand for certain services. Dependent age group below 15 and above 65 years old could require specialized health services and facilities. Age groups of 3 to 20 years old will determine demand for pre-school, elementary and secondary school facilities and primary health care; age group of 18-25 will need facilities for tertiary or even post-baccalaureate studies; the productive or working age group of 15 to 64 years old have specific demands for jobs or other forms of livelihood; and population within reproductive ages of 15 to 49 years require reproductive health programs. (See also Table 2.02.)
|
Table 2.02. Population of Individuals disaggregated by Sex and Age Group: NSO 2015 |
|||||
|
Household Population by Age Group |
Share per Age Group in % |
||||
|
Age Group |
Male |
Female |
Total |
Male |
Female |
|
All Ages |
189,757 |
196,519 |
386,276 |
49.12 |
50.88 |
|
Under 1 |
3,560 |
3,340 |
6,900 |
0.92 |
0.87 |
|
1 – 4 |
14,177 |
13,055 |
27,232 |
3.67 |
3.38 |
|
5 – 9 |
16,120 |
15,297 |
31,417 |
4.17 |
3.96 |
|
10 – 14 |
15,813 |
14,843 |
30,656 |
4.09 |
3.84 |
|
15 – 19 |
18,137 |
18,424 |
36,561 |
4.70 |
4.77 |
|
20 – 24 |
20,967 |
21,636 |
42,603 |
5.43 |
5.60 |
|
25 – 29 |
42,967 |
21,294 |
42,967 |
5.51 |
5.61 |
|
30 – 34 |
17,453 |
17,499 |
34,952 |
4.52 |
4.53 |
|
35 – 39 |
14,533 |
14,997 |
29,530 |
3.76 |
3.88 |
|
40 – 44 |
11,988 |
12,415 |
24,403 |
3.10 |
3.21 |
|
45 – 49 |
10,432 |
11,182 |
21,614 |
2.70 |
2.89 |
|
50 – 54 |
18,040 |
8,331 |
18,040 |
2.16 |
2.51 |
|
55 – 59 |
14,103 |
6,522 |
14,103 |
1.69 |
1.96 |
|
60 – 64 |
4,503 |
5,607 |
10,110 |
1.17 |
1.45 |
|
65 – 69 |
2,856 |
3,902 |
6,758 |
0.74 |
1.01 |
|
70 – 74 |
1,479 |
2,206 |
3,685 |
0.38 |
0.57 |
|
75 – 79 |
941 |
1,618 |
2,559 |
0.24 |
0.42 |
|
80 and Over |
651 |
1,535 |
2,186 |
0.17 |
0.40 |
AGE-DEPENDENCY RATIO
For both sexes, the share of the young (0-14 years) in the total population is about twenty-fivepercent (24.91%), the adult (15-64 years) over at seventy-one percent (71.16%), and the elderly (65 years above) at over three percent (3.9%). The median age, however, is approximately 26.1 years which is the age at which exactly half the population is older and half is younger. It is younger than the last computed median age (based on 2010 Census), which is 26.6.
The young-age dependency is 1 : 2.86 while the old-age dependency ratio is 1 : 18.1. This means the number of adults in the economically productive age group that can support one young dependent and elderly dependent are three (3) and eighteen (18), respectively.
Family Structure
The typical family of Mandaluyong has an average size of 4.0 members, lower than the average household size of 4.4 in 2015 for the whole country and 4.1 persons per family in NCR.
|
Table 2.03 Household Population 10 Years Old and Over (Marital Status and Sex): Mandaluyong, 2015 |
||||
|
Marital Status |
Both Sexes |
Male |
Female |
% |
|
Single |
155,515 |
79,375 |
76,140 |
48.48 |
|
Married |
109,358 |
53,786 |
55,572 |
34.1 |
|
Widowed |
12,017 |
2,161 |
9,856 |
3.75 |
|
Divorced/ Separated |
6,468 |
2,009 |
4,459 |
2.02 |
|
Common Law/ Live-In |
36,340 |
18,097 |
18,243 |
11.33 |
|
Unknown |
1,029 |
472 |
557 |
0.32 |
|
TOTAL |
320,727 |
155,900 |
164,827 |
100 |
A combination of married and widowed individuals accounts for 37.84% of the household population while family members who remain single total 48.48% with male members slightly more than female members at 51.04% and 48.96%, respectively. Others who opted for other forms of family union account for 13.67% These include individuals that are either divorced, separated, common-law spouses, and those whose marital status are unascertained. (Table 2.03).
It could be noted that population growth rate between 1995 and 2000 is valued as (-) 0.64 as seen in Table 2.04. This decrease can be attributed to population movements within and outside the city as can be observed in succeeding topics. In addition, more and more women tend to put off marriage and having a family in pursuit of higher education, high-paying jobs, and career development.
POPULATION GROWTH
Total Population
Population in the city has come a long way from just a few thousands in 1903 to almost three hundred thousand in 2000 (Table 2.04), and then to 386,276 individuals fifteen years after. Although population is increasing, the growth rate has been seesawing continuously at various degrees as it can be seen in Figure 2.03. Tremendous increase in growth rates can be noted in census years 1948-1960 and 1960-1970, the former a period of postwar reconstruction and the latter witnessing a historical event as Mandaluyong became part of the Greater Manila Area. It was during these periods when population count more than doubled in Mandaluyong.
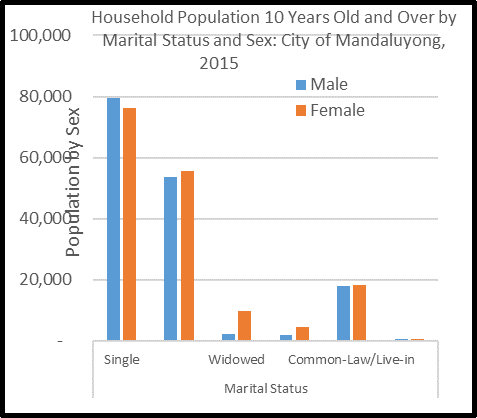
Figure 2.02 Household Population 10 Years Old and Over by Marital Status and Sex in Mandaluyong, 2015.
The next time population will double (with the 2015 census as the basis) is in about 22 to 23 years, given a growth rate of 3.12% for the 5-year period between 2010 and 2015. With these growth rates, annual populations from 2015 – 2030 are projected and listed in Table 2.05.
Growth of Barangay Population
Comparing results of five censuses from 1980-2015 (Table 2.06:), it can be noted that Addition Hills remains the most populated over the 35-year period. This is attributed to the fact that Addition Hills is the second largest barangay in the city in terms of land area, and is host to the Welfareville Property which at the moment is home to tens of thousands of informal settler families. Welfareville is actually the largest informal settlement in the country and is classified as partly new Central Business District (CBD) and partly New Town Development as per HLURB approved Comprehensive Land Use Plan 2017-2032 (CLUP) for the city.
Barangays which registered notable increases in population are Barangka Ilaya, which jumped from 5,049 in 2010 to 17,896 in 2015, and Malamig which leaped to 12,667 in 2015 from 7, 007 in 2010. That’s a difference of almost 12,000 residents for Barangka Ilaya and approximately 5,000 individuals in Malamig.
Barangay Highway Hills is home to high-rise condominiums while Barangay Mauway has recently benefited from correction and adjustment of political boundary based on official records.
|
Table 2.05. Annual Population Projections |
|
|
Year |
Projected Population |
|
Annual Growth Rate = 3.12% |
|
|
2015 |
386,276 (Census) |
|
2016 |
398,327 |
|
2017 |
410,755 |
|
2018 |
423,570 |
|
2019 |
436,785 |
|
2020 |
450,414 |
|
2021 |
464,467 |
|
2022 |
478,958 |
|
2023 |
493,901 |
|
2024 |
509,311 |
|
2025 |
525,202 |
|
2026 |
541,588 |
|
2027 |
558,486 |
|
2028 |
575,911 |
|
2029 |
593,879 |
|
2030 |
612,408 |
While large pocket areas of informal settlements could have factored in such considerable increase in population in these two barangays, Brgy. Wack-Wack is predominantly populated by high-income households in first class and exclusive subdivisions.
|
Table 2.04 Population and Growth Rate Between Census Years Sources: Handouts, Information Technology in Demographic Data Appreciation Training for LGUs, University of the POPCEN 2007, 2010, 2015 |
|||||||
|
Census Years |
1903 |
1918 |
1939 |
1948 |
1960 |
1970 |
1975 |
|
Time variant |
15.8329 |
20.0027 |
9.7479 |
11.3753 |
10.2192 |
4.9863 |
5.0 |
|
NCR |
|||||||
|
Population |
328,939 |
461,166 |
993,889 |
1,569,128 |
2,462,488 |
3,966.695 |
4,970,006 |
|
Growth Rate |
2.13 |
3.84 |
4.68 |
3.96 |
4.67 |
4.52 |
3.52 |
|
Mandaluyong City |
|||||||
|
Population |
4,349 |
5,806 |
18,200 |
26,309 |
71,619 |
149,407 |
182,267 |
|
Growth Rate |
1.82 |
5.71 |
3.78 |
8.80 |
7.20 |
3.99 |
2.39 |
|
Cont. Table 2.04 |
|||||||
|
Census Years |
1980 |
1990 |
1995 |
2000 |
2007 |
2010 |
2015 |
|
Time Variant |
10.0 |
5.3370 |
4.6630 |
10 |
- |
10 |
5 |
|
NCR |
|||||||
|
Population |
5,925,884 |
7,948,392 |
9,454,040 |
9,932,560 |
11,553,427 |
11,855,975 |
12,877,253 |
|
Growth Rate |
2.94 |
3.25 |
1.06 |
2.23 |
2.11 |
1.78 |
1.58 |
|
Population |
205,366 |
248,143 |
285,584 |
278,474 |
305,576 |
328,699 |
386,276 |
|
Growth Rate |
1.89 |
2.72 |
-0.64 |
1.15 |
1.29 |
1.67 |
3.12 |
POPULATION DISTRIBUTION AND URBANIZATION
Level of Urbanization
Despite the presence of low-income households and informal settlers, the city has been one hundred percent urban with an income classification of a first-class city since 1994.
Population Densities
An analysis of barangay population densities in the light of existing conditions in each respective area shows a pattern by which population is concentrated. The obvious difference in the distribution of population in the city is shown in Figure 2.04. However, it should be noted that shown are total densities and not residential densities.
Interpreting these densities as low, medium or high does not necessarily indicate the actual character of the built-up areas as these may include large areas occupied by commercial establishments as in the case of Barangays Barangka Ilaya and Buayang Bato, both with low densities and are predominantly commercial and industrial in use.
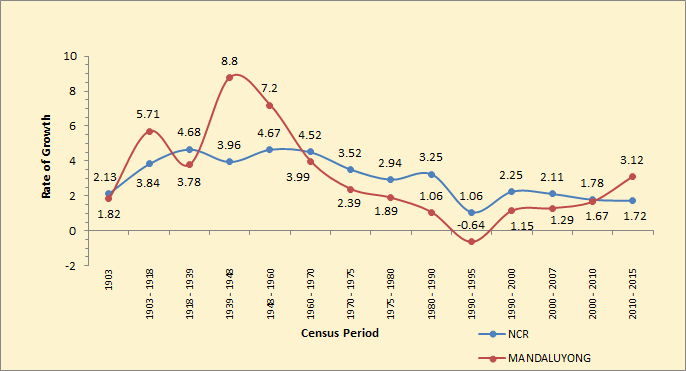
Figure 2.03 Rate of Growth of Population Between Census Periods
RELIGION
About ninety percent (90.21%) of the residents are parishioners of Roman Catholic Church, and the remaining are distributed among religious denominations like the Iglesia ni Kristo (2.5%), Evangelicals (0.54%), other Protestants (0.28%), Jehovah’s Witness (0.48%), Aglipayan (0.24%), Islam (0.74%) and others (5.01%). (Table 2.07).
|
Table 2.06. Comparative Report on Population by Barangay, 1980-2015 (Source: NSO Censuses) |
|||||||
|
Barangay |
Population |
Participation Rate 2015 |
|||||
|
1980 |
1990 |
1995 |
2000 |
2010 |
2015 |
||
|
Addition Hills |
15,535 |
35,518 |
60,142 |
69,885 |
86,731 |
99,058 |
25.64% |
|
Bagong Silang |
4,247 |
3,960 |
3,838 |
4,162 |
4,652 |
5,572 |
1.44% |
|
Barangka Drive |
10,580 |
12,225 |
14,171 |
12,670 |
12,227 |
13,310 |
3.45% |
|
Barangka Ibaba |
6,800 |
8,153 |
9,621 |
8,943 |
9,241 |
9,540 |
2.47% |
|
Barangka Ilaya |
5,650 |
6,179 |
6,222 |
4,461 |
5,049 |
17,896 |
4.63% |
|
Barangka Itaas |
9,012 |
10,442 |
11,539 |
10,811 |
11,061 |
11,252 |
2.91% |
|
Buayang Bato |
2,207 |
2,551 |
2,757 |
1,083 |
1,340 |
1,782 |
0.46% |
|
Burol |
1,176 |
1,322 |
1,397 |
2,634 |
2,606 |
2,740 |
0.71% |
|
Daang Bakal |
4,127 |
3,767 |
3,814 |
2,797 |
3,931 |
3,660 |
0.95% |
|
Hagdang Bato Itaas |
10,117 |
10,251 |
10,480 |
9,769 |
10,102 |
10,314 |
2.67% |
|
Hagdang Bato Libis |
7,522 |
7,769 |
6,815 |
6,204 |
6,716 |
6,962 |
1.80% |
|
Harapin Ang Bukas |
4,439 |
4,754 |
4,756 |
3,981 |
4,073 |
4,496 |
1.16% |
|
Highway Hills |
12,904 |
14,503 |
14,220 |
12,131 |
22,684 |
28,703 |
7.43% |
|
Hulo |
13,996 |
17,160 |
19,949 |
20,585 |
21,107 |
27,515 |
7.12% |
|
Mabini J./Rizal |
6,856 |
7,017 |
6,336 |
6,418 |
6,773 |
7,628 |
1.97% |
|
Malamig |
8,128 |
6,534 |
6,831 |
5,853 |
7,007 |
12,667 |
3.28% |
|
Mauway |
11,081 |
10,366 |
16,200 |
16,877 |
25,129 |
29,103 |
7.53% |
|
Namayan |
3,124 |
4,816 |
4,822 |
4,889 |
5,706 |
6,123 |
1.59% |
|
New Zaniga |
6,000 |
6,457 |
5,704 |
5,555 |
6,354 |
7,534 |
1.95% |
|
Old Zaniga |
5,227 |
5,769 |
7,082 |
5,843 |
7,712 |
7,013 |
1.82% |
|
Pag-asa |
4,393 |
4,427 |
4,414 |
3,847 |
3,688 |
4,053 |
1.05% |
|
Plainview |
19,574 |
29,077 |
30,528 |
24,608 |
24,396 |
26,575 |
6.88% |
|
Pleasant Hills |
3,767 |
4,167 |
5,654 |
6,115 |
5,648 |
5,910 |
1.53% |
|
Poblacion |
14,593 |
14,841 |
16,301 |
14,751 |
15,191 |
14,733 |
3.81% |
|
San Jose |
6,021 |
6,272 |
4,587 |
6,227 |
7,041 |
7,262 |
1.88% |
|
Vergara |
4,613 |
4,553 |
4,482 |
4,153 |
4,645 |
5,910 |
1.53% |
|
Wack-Wack Green Hills |
3,580 |
3,281 |
2,922 |
3,222 |
7,889 |
8,965 |
2.32% |
|
TOTAL |
205,368 |
246,131 |
285,584 |
278,474 |
328,699 |
386,276 |
100% |
ETHNICITY AND ORIGIN
Almost everyone in Mandaluyong is Filipino. While a great majority is Tagalog, people of various ethnic origins from all over the Philippines and even from other countries and nationalities had made Mandaluyong their home for quite some time now. Even so, the languages generally spoken
in the households are Tagalog (96.47%), Bicol (0.40%), Bisaya (0.30%), Ilonggo (0.41%), Kankanay (0.28%), Waray (0.21%), Cebuano (0.21%), Ilocano (0.57%) and Others (1.15%). See Table 2.09.
|
Table 2.07 Total Population by Religious Affiliation and Sex (Source: PSA, 2015 Census) |
|||
|
Religious Affiliation |
Both Sexes |
Male |
Female |
|
Roman Catholic |
348,450 |
171,868 |
176,582 |
|
Aglipayan |
931 |
414 |
517 |
|
Islam |
2,842 |
1,331 |
1,511 |
|
Iglesia ni Krsito |
9,660 |
4,660 |
5,000 |
|
Other Protestant |
1,100 |
529 |
571 |
|
Buddhist |
305 |
156 |
149 |
|
Jehovah’s Witness |
1,853 |
847 |
1,006 |
|
Tribal Religions |
5 |
1 |
4 |
|
Others |
20,437 |
9,579 |
10,858 |
|
None |
66 |
32 |
34 |
|
Unknown |
627 |
340 |
287 |
|
TOTAL |
386,276 |
189,757 |
196,519 |
|
Table 2.08. No. of Births to Women of Specific Age Group : 2015 – 2017 (Source: Civil Registry Department) |
|||
|
Age Group |
No. of Birth |
||
|
2015 |
2016 |
2017 |
|
|
10-14 |
8 |
14 |
1 |
|
15-19 |
566 |
710 |
682 |
|
20-24 |
1,505 |
1,702 |
1,541 |
|
25-29 |
1,407 |
1,740 |
1,650 |
|
30-34 |
1,082 |
1,219 |
1,126 |
|
35-39 |
584 |
701 |
726 |
|
40-44 |
138 |
232 |
245 |
|
45-49 |
8 |
3 |
10 |
|
TOTAL |
5,298 |
6,321 |
5,981 |
|
Table 2.09. Language or Dialect Generally Spoken in the Households : 2000 |
|
|
Language/ Dialect |
No. of Households |
|
Abelling |
64 |
|
Abiyan |
10 |
|
Aeta/Ayta |
10 |
|
Bikol/Bicol |
236 |
|
Bisaya/Binisaya |
182 |
|
Boholano |
11 |
|
Cebuano |
127 |
|
Davao-Chavacano |
10 |
|
Hiligaynon, Ilonggo |
244 |
|
Ibanag |
31 |
|
Ilocano |
342 |
|
Itawis |
10 |
|
Itneg |
82 |
|
Kankanai/Kankaney/Kankanaey |
167 |
|
Kapampangan |
71 |
|
Karay-a |
20 |
|
Manobo/Ata-Manobo |
22 |
|
Maranao |
0 |
|
Masbateño/ Masbatenon |
10 |
|
Palawan/Pinalawan/Palawanon |
10 |
|
Pangasinan/ Panggalato |
31 |
|
Romblon/ Rombloanon |
9 |
|
Sama(Samal)/ Abaknon |
31 |
|
Surigaonon |
9 |
|
Tagalog |
57,575 |
|
Tausug |
94 |
|
Waray |
126 |
|
Chinese |
31 |
|
American/ English |
87 |
|
Other Foreign Ethnicity |
10 |
|
Total |
59,682 |
|
Source: NSO 2000 |
|